 Copyright © Michael Richmond.
This work is licensed under a Creative Commons License.
Copyright © Michael Richmond.
This work is licensed under a Creative Commons License.
Let's work through the stages of finding the PREDICTED (or "calculated") and OBSERVED phases of a variable star. We'll select the eclipsing binary RT And as our target in this example.
The first step is to look up two properties in the General Catalog of Variable Stars (GCVS).
In the case of RT And, we find values
Now, when one looks at the entry for RT And in the GCVS, the epoch value is listed as "51421.737", which is a slightly abbreviated form. One must add 2,400,000.0 to that value to achieve the proper Julian Date. In this case, JD 2451421.737 corresponds to Aug 30, 1999. That was over two decades ago.
The epoch provides one date when the star was at minimum light. Below is a light curve of RT And taken from Manzoori, AJ 138, 1917 (2009).
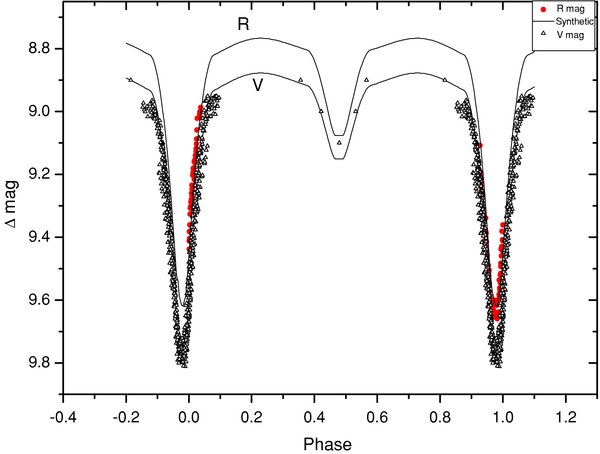
Figure 1 taken from
Manzoori, AJ 138, 1917 (2009)
This is the light curve of an eclipsing binary in its standard format: the primary minimum -- the deeper of the two dips -- is shown at phase 0.0, and the secondary minimum appears at phase 0.5. For this star, the primary minimum shows a decrease in brightness of about 0.8 mag, while the secondary dip is much smaller, about 0.2 mag.
So, the catalog entry tells us that on Aug 30, 1999, the primary minimum occurred at Julian Date 2451421.737. Fine.
On Nov 06/07, 2020, we observed RT And at the RIT Observatory. Our measurements in the R-band are shown below.
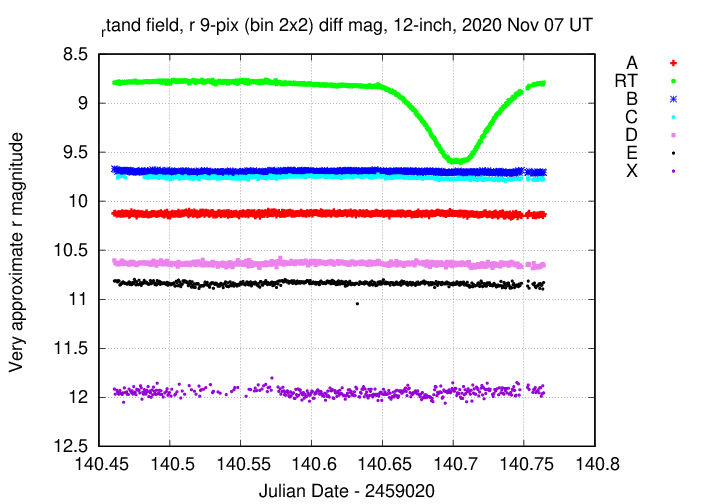
The dip in brightness is about 0.8 magnitudes, so we observed a primary minimum. On the graph, we can see that the OBSERVED time of minimum was about JD = 2459160.70.
Now, does this match the time which would be CALCULATED from the star's catalog entry? Let's find out. Given any particular Julian Date, we can calculate the phase from the catalog like so:
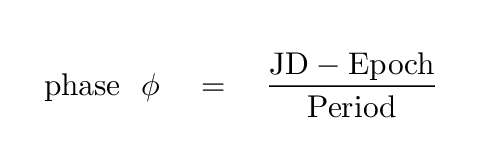
So, for example, the times when the observations started and ended, and the observed time of the dip, yield the following calculated phases:
    Julian Date               phase               comment
-----------------------------------------------------------------------
   2459160.46                 0.74           start of measurements

   2459160.70                 0.14           middle of primary minimum

   2459160.76                 0.22           end of measurements
-----------------------------------------------------------------------
Hey, wait a minute! The primary minimum is supposed to appear at phase = 0.0. But we observed it to occur at phase 0.14. Did we do something wrong?
The observed time of minimum didn't match the prediction. Did we do something wrong?
Well, first, we might have made a mistake in the calculations. It's always a good idea to double-check all one's work. In this case, though, there is no error in the calculations. The real dip really does occur slightly later than the prediction.
How big is the difference in time? Using the star's ephemeris (that's a fancy word for "catalog values of period and epoch"),
     Epoch                                               2451421.7370

       + 12,305 cycles * (0.6289216 day/cycle)  =         + 7738.8803
                                                       -----------------
                                                         2459160.6173
We can then compute the difference between the observed time of minimum and the calculated time; this quantity is often called the "(O-C)", which is short for "observed minus calculated".
  Observed minimum       JD   2459160.705

  Predicted              JD   2459160.617

--------------------------------------------

  Difference in days                0.087    =  (O-C)  Observed - Calculated
Now, just a single measurement might contain an error of some sort. But if people make several measurements, and they all show similar values, then the effect is very likely to be real.
In the case of RT And, other people have made measurements of the time of minimum. For example, back in the summer of 2014, some astronomers in Europe observed its light curve. They reported their findings in a short paper, which includes measurements of many eclipsing variables: Hubscher and Lehmann, IBVS 6149 (2015).
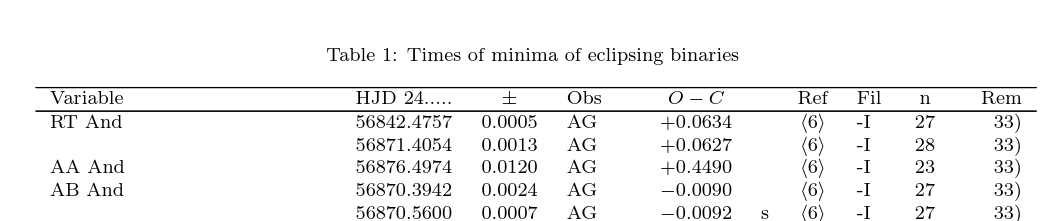
A portion of Table 1, taken from
Hubscher and Lehmann, IBVS 6149 (2015).
Back in 2014, the difference (O-C) was also not zero. It was about 0.063 days, a bit smaller than the value we measured in 2020.
Hmmm. It seems that the (O-C) value may have been growing with time. If we had more measurements over a long interval, we might be able to determine if this value grows steadily, or in jumps, or accelerates ... There are several physical mechanisms which might cause the orbit of a binary star to change over periods of years. A good set of measurements of the (O-C) values can give us important clues about which -- if any -- of those mechanisms might be active in some particular binary star.
Copyright © Michael Richmond.
This work is licensed under a Creative Commons License.