Today, our topic is astrometry, the science of measuring positions of celestial objects. You will have two different little projects to do today, to help illustrate two different facets of this field.
ssh -Y -l student spiff.rit.edu
When asked for a password, supply the value
I will tell you.
            propinit

            cd grant         (or your own first name here)

            ls
You should now be in the directory with the images you'll need. The two images you'll use for the parallax experiment are
           rit.fit              an image taken from the RIT Observatory
           usna.fit             an image taken from the US Naval Academy
You can display one of the image by using the tv command, like so:
tv rit.fit zoom=2
A new window should pop up like this:
The zoom=2 argument zooms into the image, making it twice as big as it really is. You can use zoom=0.5 to make an image appear smaller, or leave out the zoom keyword entirely to see the image at its normal size.
If you move your cursor into the image, you should see the coordinates (bottom of the window) change as you move the cursor. If the coordinates DON'T change, then click on the window's bar at the top. If they STILL don't change, left-click once while pointing anywhere in the image.
There are three keys you can use to measure stellar properties.
( 499.69 563.62) flux 9108.6 npix 49.5 mag 15.101 sky 32.0 [ 4.0 8 15]The number after "mag" will give you the instrumental magnitude of the star in this image.
To destroy an image window, you can right-click while the cursor is inside it, or use the Mac red-color-button at the top left of the window.
One way to measure the distance to objects is via parallax, which involves measuring the apparent shift in position of an object when it is viewed from two different locations. You are probably most familiar with heliocentric parallax, in which measurements of a star are made 6 months apart and the orbit of the Earth provides the baseline.
In this case, however, two images were taken simultaneously. I took one from the RIT Observatory, and a colleague that US Naval Academy in Annapolis, Maryland, took the other. You can use the locations of our two observatories to determine the baseline for the measurements.
                             latitude        longitude
    ---------------------------------------------------
    RIT Observatory          43:04:33         77:39:53

    US Naval Academy         38:58:41         76:29:31
In order to determine the angle by which the asteroid appeared to shift, you need to measure the position of the asteroid relative to some other star in each image. You'll also need to determine the plate scale of each image -- in other words, the relationship between pixels and arcseconds. You can use this chart as a guide:
In this chart, stars B and D are 704 arcseconds apart.
The next step is to measure the location of the asteroid relative to some reference point in each image. One approach is to set up a coordinate system using the line connecting stars B and D. If you measure the vectors B-D and B-asteroid, you should be able to compute the x-component and y-component of the vector B-asteroid. Do that in both images, and you can then find the shift in the position of the asteroid.

Once you have the parallax angle θ, you can compute the distance to the asteroid.
| What is your value for the distance to this asteroid? |
Note that there are some complications that I've ignored in this exercise, which mean that your value is only a lower limit to the distance. Can you explain what these complications might be?
If we take a picture showing a large area of the sky, then we run into a big problem: the positions of stars will be distorted, because our telescope projects the image of a curved, three-dimensional sky onto a flat, two-dimensional surface.
This distortion is the same reason that maps of large portions of the Earth's surface can look strange. This map make Greenland look as large as Africa, but it actually has less than one-tenth the area!
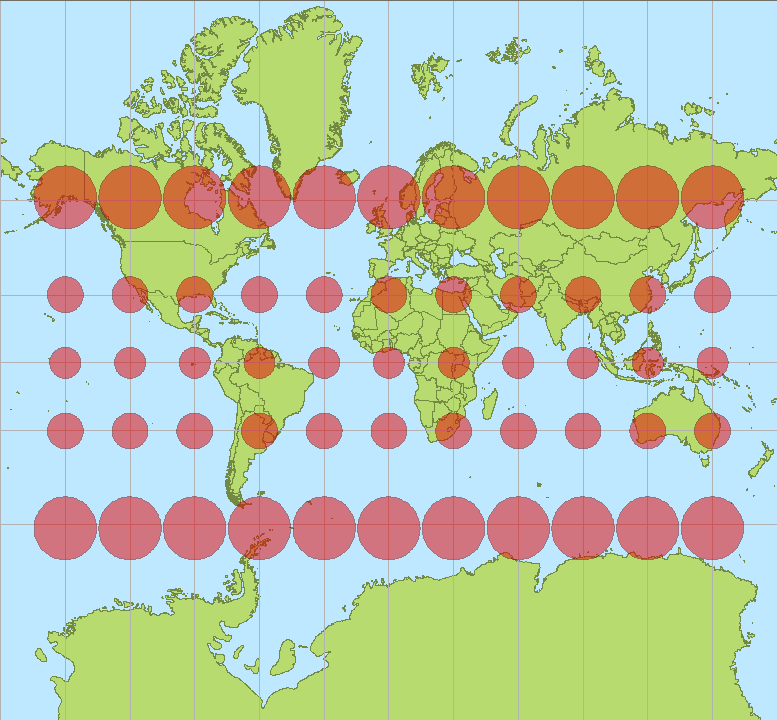
This Mercator projection of the Earth courtesy of
Stefan Kuhn and Wikimedia Commons
So, one ingredient in a successful astrometrical recipe is a good method for accounting for the distortions involved in projecting the celestial sphere onto a plane.
Another ingredient is a good set of reference stars with known positions. In the optical regime, the best astrometric catalogs at the present time are
When you find yourself with an image of some portion of the sky, and you want to compute the positions of stars in the image, you can follow these steps:
Today, I'd like simply to illustrate the procedure, so I'll do most of the work for you. We'll start with an image of this pretty galaxy: m51.fit.
I've measured the positions and instrumental magnitudes of the brightest stars in this image. You can find them in the file m51.pht. The columns are
I've also gathered the (RA, Dec) positions of many stars in this region from the USNO B1.0 catalog. You can find these positions in the file m51cat.dat. In this file, the important columns are
  0 - an index number
  9 - the Right Ascension (decimal degrees)
 10 - the Declination (decimal degrees)
 11 - the R-band magnitude
So, given all this preliminary work, your job is pretty easy.
              RA  =  202.4676    degrees
              Dec =  +47.1932    degrees
We will use a program which is part of the
"match" group
of programs.
This one projects (RA, Dec) onto a plane, centered at some
specific position.
Here's how to run it:
project_coords m51cat.dat 9 10 202.4676 47.1932 outfile=m51cat.proj
Compare the two files m51cat.dat and m51cat.proj. What is the same? What has changed? The position of each object has been converted from degrees into radians, and the center of the coordinate system is the (RA, Dec) value you typed in the command.
        xi   =  a  +  bx  +  cy
        eta  =  d  +  ex  +  fy
To run this program, type (all on one line)
        match m51.pht 1 2 5 m51_proj.dat 9 10 11 id1=0 id2=0
            matchrad=0.000024 nobj=30 linear trirad=0.001 recalc
If all goes well, you'll see a set of numbers printed out, something like this:
      TRANS: a=0.004369603     b=-0.000008157    c=-0.000002399
             d=-0.003236631    e=-0.000002400    f=0.000008158
             sig=4.5759e-12 Nr=85 Nm=85 sx=1.5888e-06 sy=1.8051e-06
The numbers listed for a, b, c, d, e, f are the coefficients of the linear transformation which will take (x, y) coordinates and turn them into (xi, eta). We are almost done!
Disclaimer: this step is often the trickiest one in the whole process. There are many, many parameters which control the matching procedure. Read the match package manual for details, or talk to me, if you ever run into trouble.
         apply_match m51.pht 1 2 202.4676 47.1932 linear
                a   b   c   d   e    f
                outfile=m51.radec
Now, in this command, you need to replace the a, b, etc.,
with the numerical values you found in the previous step.
If all goes well, you'll find that the m51.radec file contains a list of all the detected stars with the instrumental magnitudes -- just like before -- but now, the columns for (x, y) positions have been replaced with (RA, Dec) values.
| In the list of objects detected in the image, there was one faint star at (677.84, 132.47). What are the (RA, Dec) coordinates of this star? |
For more information