 Copyright © Michael Richmond.
This work is licensed under a Creative Commons License.
Copyright © Michael Richmond.
This work is licensed under a Creative Commons License.
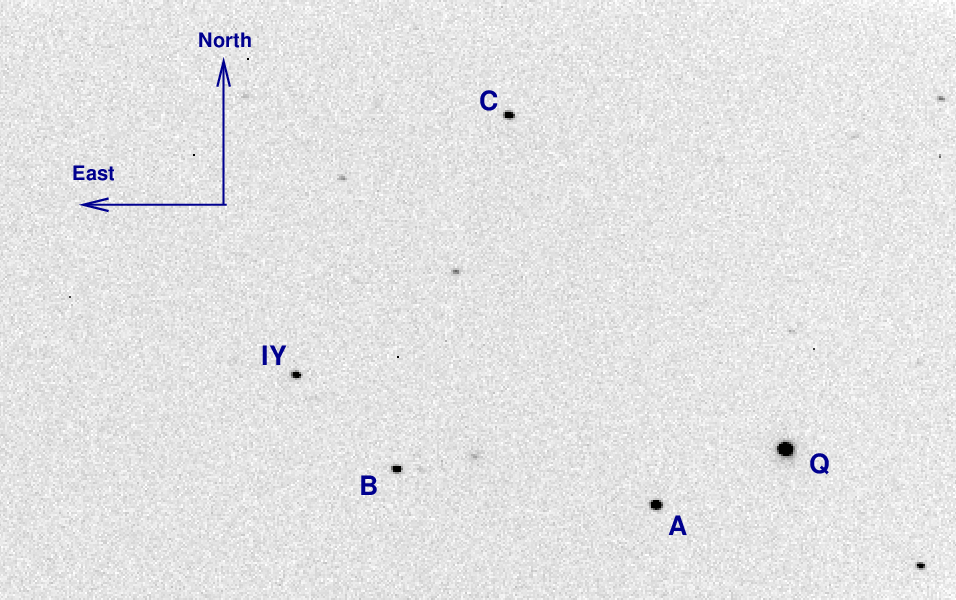
This exerise involves measurements of stars in the field of the variable star IY UMa , which is at RA = 10:43:56.73, Dec = +58:07:31.9 (J2000). The chart below is based on one of the images I acquired at the RIT Observatory on Apr 11, 2006.
You can download FITS images of this field from one of my courses, if necessary (but it shouldn't be):
I've performed aperture photometry in the usual manner to measure the instrumental magnitudes of the stars "A", "B", "C", and "IY", using an aperture of radius 5 pixels. I've placed the results into a table
that looks something like this:
#    JD            A       B       C      IY
2453837.55043   13.5940 14.8260 14.6970 15.2840
2453837.55095   13.6820 14.9250 14.8150 15.3310
2453837.55147   13.7220 14.9170 14.8340 15.3420
where the columns are:
Now it's your turn:
          diff mag A  =  mag(A)  - mag(B)
          diff mag B  =  mag(B)  - mag(B)
          diff mag C  =  mag(C)  - mag(B)
          diff mag IY =  mag(IY) - mag(B)
For the first image, for example, the differential magnitudes
will look like this:
       #    JD           A-B      B-B     C-B    IY-B
       2453837.55043   -1.232    0.000  -0.129  0.458
Save these values in a new text file.
Now, let's do a simple sort of photometric calibration.
It might help if you refer to the following chart, which is based on the Digitized Sky Survey used by Aladin, rather than one of my RIT Observatory images.
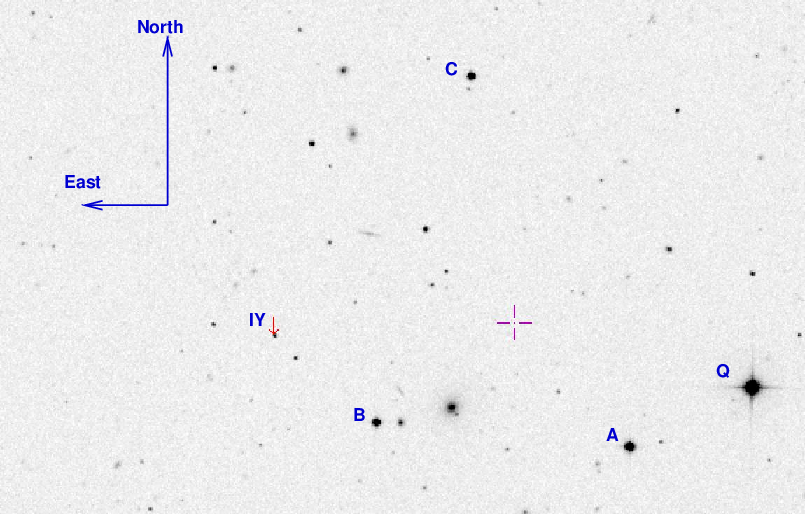
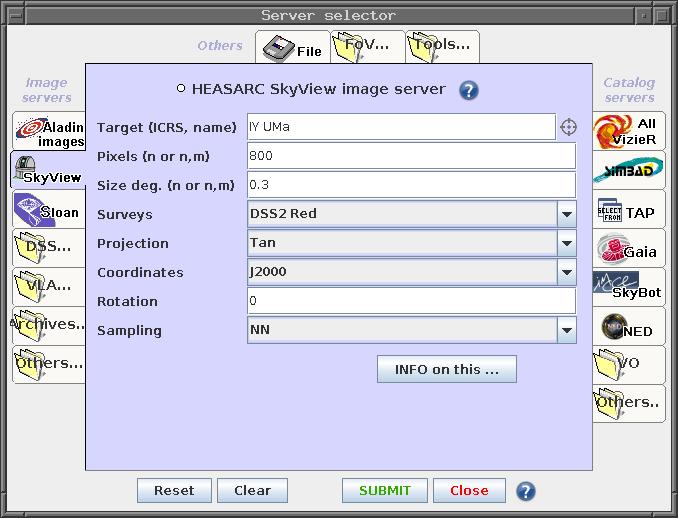
(Having trouble identifying these stars? I recommend using Aladin, then choosing "File -> Open server selector", and filling in the options so that they look like the figure below. That should give you a chart with field of view about 19 x 19 arcminutes.)
             delta_A = (diff mag A) - (V-band mag of A)
             delta_B = (diff mag B) - (V-band mag of B)
             delta_C = (diff mag C) - (V-band mag of C)
avg_delta = (1/3) * (delta_A + delta_B + delta_C)
             calib_A  =  (diff mag A)  - avg_delta
             calib_B  =  (diff mag B)  - avg_delta
             calib_C  =  (diff mag C)  - avg_delta
             calib_IY =  (diff mag IY) - avg_delta
Now you can provide other astronomers with roughly calibrated V-band magnitudes for star IY
http://spiff.rit.edu/classes/phys445/work/apr11_2006/You should find 99 images, each a simple 16-bit integer FITS image, 510-by-340 pixels in size.
Copyright © Michael Richmond.
This work is licensed under a Creative Commons License.