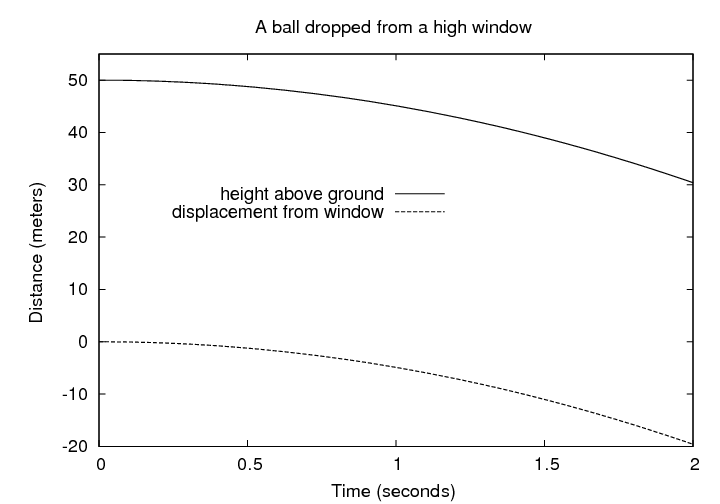
Task 1: Create a graph which shows both the displacement of the ball from the window, and the velocity of the ball, as a function of time, from t = 0 to t = 2 seconds. Give your graph reasonable labels.
  set xlabel "Time since ball was dropped (s)"
  set ylabel "Distance (m) "
  set title "Dropping a ball from a window"
  set grid
  plot [0:2.2] (0-0.5*9.8*x*x) t 'height above ground' lw 2,
                       (50-0.5*9.8*x*x) t 'displacement from window' lw 2
Task 2: Create a graph which shows a closeup of the weak absorption line in this datafile centered near 6547.7 Angstroms. Zoom in so that the data in this region cover your graph from left to right and from top to bottom.Use your graph to estimate the central wavelength of this line, the approximate width of the line, and its approximate depth.
  set xlabel "Wavelength (Angstroms)"
  set ylabel "Intensity of light (arbitary scale)"
  set title "A small section of the solar spectrum"
  set grid
  plot [6547.58:6547.83][] "spec_closeup.dat" using 1:2
                     with linespoints pt 5 lw 2
Using this graph, I estimate
Task 3: Generate your own datafiles which contain intensity as a function of wavelength for bodies with temperatures of 300, 1000, 3000, and 10,000 Kelvin. Create a single graph which shows the blackbody spectrum (intensity per unit wavelength as a function of wavelength) for all four bodies. Use a range of wavelengths which is wide enough to show the peak of all the spectra.
  set xlabel "Wavelength (m)"
  set ylabel "Intensity of blackbody radiation (Joules/sq.m/sec/m/steradian)"
  set title "Blackbodies at different temperatures"
  set grid
  set logscale y
  set logscale x
  set key bot right
  plot [1e-08:1e-02][1e-10:1e+35] "bb_lam.300.out" using 2:3 t '300 K',
                                  "bb_lam.1000.out" using 2:3 t '1000 K',
                                  "bb_lam.3000.out" using 2:3 t '3000 K',
                                  "bb_lam.10000.out" using 2:3 t '10000 K',
Task 4: Use your graph to measure the wavelength at which each body's spectrum has its peak. Create a new graph which shows the peak wavelength of a body as a function of its temperature.
  set xlabel "Temperature (K)"
  set ylabel "Wavelength at which spectrum reaches its peak (m)"
  set title "Blackbodies at different temperatures"
  set grid
  set nologscale x
  set nologscale y
  set key top right
  plot [0:11000] "mwr_blackbody_peak.dat" using 1:2 with linespoints pt 4 t ''
Notice what happens if we plot the wavelength of the peak as a function of (1/temperature).
  set xlabel "1 / Temperature (K)"
  set ylabel "Wavelength at which spectrum reaches its peak (m)"
  set title "Blackbodies at different temperatures"
  set grid
  set key top right
  plot [] "mwr_blackbody_peak.dat" using (1/$1):2 with linespoints pt 4 t ''